


Trusted by over 15 Million Traders
The Most Awarded Broker
for a Reason
Easy Access to 1,400+ Global Assets
EURUSD
Euro vs U.S. Dollar
US500
S&P 500 (US500)
GOLD
Gold
COFFEE
US Coffee
Apple
Apple (AAPL.OQ)
-

Finance Magnates 颁发
-

Finance Magnates 颁发
-

Capital Finance International Magazine (CFI.co) 2024年颁赠
-

COLWMA 2024年颁赠
-

荣获World Finance Forex Awards 2023最佳外汇客户服务奖
-

荣获World Finance Forex Awards 2023欧洲最佳外汇经纪商奖
-

荣获World Finance Forex Awards 2023澳大拉西亚最佳外汇经纪商奖
-

荣获World Finance Forex Awards 2023拉丁美洲最佳外汇经纪商奖
-

荣获World Finance Forex Awards 2023中东最佳外汇经纪商奖
-

CFI.co于2023年颁赠
-

荣获2023年City of London Wealth Management Awards
-

荣获2022年埃及金融博览会颁赠
-

荣获2022年City of London Wealth Management Awards
-

CFI.co于2022年颁赠
-

荣获Global Forex Awards 2022 — 零售外汇 颁赠
-
2021年迪拜外汇博览会获颁赠
-

Ultimate Fintech 2021年颁赠
-

荣获2021年City of London Wealth Management Awards
-

FX168于2020年12月颁赠
-

荣获Global Business Awards 2020
-

荣获2020年City of London Wealth Management Awards
-

Capital Finance International Magazine (CFI.co)颁赠
-

Capital Finance International Magazine (CFI.co)颁赠
-

荣获2019年City of London Wealth Management Awards
-

Shares Magazine 授予 UK Forex Awards 2018
-

Capital Finance International Magazine (CFI.co)颁赠
-

Capital Finance International Magazine (CFI.co)颁赠
-

2017年伦敦财富管理奖
-

2016最佳本土 客户服务
-

中东和北非地区(MENA)增长最快的经纪商
-
2015年最佳外汇科技提供商
-
2014年最佳外汇科技提供商
-

2014年最佳外汇科技提供商
-

荣获 The Trading Show 2024年非洲 Africa Fintech 峰会颁赠
-

荣获2024年中东地区 Brokersview 颁赠
-
荣获2024年中东地区 Brokersview 颁赠
-

荣获2024年阿曼 Smart Vision 峰会颁赠
-

荣获2024年迪拜外汇博览会颁赠
-

荣获2024年迪拜 Forex Traders Summit 颁赠
-

2024年埃及 Smart Vision 峰会颁赠
-

投查查于2024年颁赠
-

Capital Finance International Magazine (CFI.co) 2024年颁赠
-

CFI.co于2023年颁赠
-

CFI.co于2023年颁赠
-

交易社区平台FOLLOWME于2022年颁赠
-
2022年迪拜Forex Expo获颁赠
-
2022年迪拜Forex Expo获颁赠
-

荣获Global Forex Awards 2022 — 零售外汇 颁赠
-

CFI.co于2022年颁赠
-

CFI.co于2022年颁赠
-

World Finance Forex Awards 2022 颁发
-

World Finance Forex Awards 2022 颁发
-

World Finance Forex Awards 2022 颁发
-

World Finance Forex Awards 2022 颁发
-
交易社区平台FOLLOWME于2021年颁赠
-

2021年埃及Smart Vision Investment Expo博览会获颁赠
-

CFI.co于2021年颁赠
-

CFI.co于2021年颁赠
-

荣获Global Forex Awards 2021 — 零售外汇 颁赠
-

荣获Global Forex Awards 2021 — 零售外汇 颁赠
-

World Finance 2021颁发
-

World Finance 2021颁发
-
FOLLOWME于2021年颁赠
-

Global Forex Awards 2021 — B2B 颁赠
-

Global Forex Awards颁赠
-

Global Forex Awards颁赠
-

CFI.co于2020年颁赠
-

CFI.co于2020年颁赠
-

荣获Global Business Awards 2020
-

World Finance Magazine 颁赠
World Finance Forex Awards 2020 -

World Finance Magazine 颁赠
World Finance Forex Awards 2020 -
FOLLOWME交易社区授予
-

Global Forex Awards颁赠
-

Global Forex Awards颁赠
-

FinTech Age Awards颁发
-

World Finance Magazine 颁赠
World Finance Forex Awards 2019 -

World Finance Magazine 颁赠
World Finance Forex Awards 2019 -

荣获 World Finance Forex Awards 2018 颁赠
-

荣获2018年埃及金融博览会颁赠
-

荣获 Shares Magazine 的 UK Forex Awards 2017 颁赠
-

荣获 World Finance Forex Awards 2017
-

2016年最佳黄金经纪商
-

2016年最佳外汇经纪商
-

2015年最佳本地客户服务
-

Global Brands Magazine 颁赠
-

Online Money Awards 2022 颁发
-

荣获2022年埃及金融博览会颁赠
-

2015最佳外汇交易平台
-

2015最佳金融交易平台
-

2013最佳创新外汇平台奖
-

2020年 Cyprus HR Awards 颁赠
-

金融行业的佼佼者
-

认证最优金牌级别
-

2014年首届亚军
-
Finance Magnates 颁发
-
Finance Magnates 颁发
-
Capital Finance International Magazine (CFI.co) 2024年颁赠
-
COLWMA 2024年颁赠
-
荣获World Finance Forex Awards 2023最佳外汇客户服务奖
-
荣获World Finance Forex Awards 2023欧洲最佳外汇经纪商奖
-
荣获World Finance Forex Awards 2023澳大拉西亚最佳外汇经纪商奖
-
荣获World Finance Forex Awards 2023拉丁美洲最佳外汇经纪商奖
-
荣获World Finance Forex Awards 2023中东最佳外汇经纪商奖
-
CFI.co于2023年颁赠
-
荣获2023年City of London Wealth Management Awards
-
荣获2022年埃及金融博览会颁赠
-
荣获2022年City of London Wealth Management Awards
-
CFI.co于2022年颁赠
-
荣获Global Forex Awards 2022 — 零售外汇 颁赠
-
2021年迪拜外汇博览会获颁赠
-
Ultimate Fintech 2021年颁赠
-
荣获2021年City of London Wealth Management Awards
-
FX168于2020年12月颁赠
-
荣获Global Business Awards 2020
-
荣获2020年City of London Wealth Management Awards
-
Capital Finance International Magazine (CFI.co)颁赠
-
Capital Finance International Magazine (CFI.co)颁赠
-
荣获2019年City of London Wealth Management Awards
-
Shares Magazine 授予 UK Forex Awards 2018
-
Capital Finance International Magazine (CFI.co)颁赠
-
Capital Finance International Magazine (CFI.co)颁赠
-
2017年伦敦财富管理奖
-
2016最佳本土 客户服务
-
中东和北非地区(MENA)增长最快的经纪商
-
2015年最佳外汇科技提供商
-
2014年最佳外汇科技提供商
-
2014年最佳外汇科技提供商
-
荣获 The Trading Show 2024年非洲 Africa Fintech 峰会颁赠
-
荣获2024年中东地区 Brokersview 颁赠
-
荣获2024年中东地区 Brokersview 颁赠
-
荣获2024年阿曼 Smart Vision 峰会颁赠
-
荣获2024年迪拜外汇博览会颁赠
-
荣获2024年迪拜 Forex Traders Summit 颁赠
-
2024年埃及 Smart Vision 峰会颁赠
-
投查查于2024年颁赠
-
Capital Finance International Magazine (CFI.co) 2024年颁赠
-
CFI.co于2023年颁赠
-
CFI.co于2023年颁赠
-
交易社区平台FOLLOWME于2022年颁赠
-
2022年迪拜Forex Expo获颁赠
-
2022年迪拜Forex Expo获颁赠
-
荣获Global Forex Awards 2022 — 零售外汇 颁赠
-
CFI.co于2022年颁赠
-
CFI.co于2022年颁赠
-
World Finance Forex Awards 2022 颁发
-
World Finance Forex Awards 2022 颁发
-
World Finance Forex Awards 2022 颁发
-
World Finance Forex Awards 2022 颁发
-
交易社区平台FOLLOWME于2021年颁赠
-
2021年埃及Smart Vision Investment Expo博览会获颁赠
-
CFI.co于2021年颁赠
-
CFI.co于2021年颁赠
-
荣获Global Forex Awards 2021 — 零售外汇 颁赠
-
荣获Global Forex Awards 2021 — 零售外汇 颁赠
-
World Finance 2021颁发
-
World Finance 2021颁发
-
FOLLOWME于2021年颁赠
-
Global Forex Awards 2021 — B2B 颁赠
-
Global Forex Awards颁赠
-
Global Forex Awards颁赠
-
CFI.co于2020年颁赠
-
CFI.co于2020年颁赠
-
荣获Global Business Awards 2020
-
World Finance Magazine 颁赠
World Finance Forex Awards 2020 -
World Finance Magazine 颁赠
World Finance Forex Awards 2020 -
FOLLOWME交易社区授予
-
Global Forex Awards颁赠
-
Global Forex Awards颁赠
-
FinTech Age Awards颁发
-
World Finance Magazine 颁赠
World Finance Forex Awards 2019 -
World Finance Magazine 颁赠
World Finance Forex Awards 2019 -
荣获 World Finance Forex Awards 2018 颁赠
-
荣获2018年埃及金融博览会颁赠
-
荣获 Shares Magazine 的 UK Forex Awards 2017 颁赠
-
荣获 World Finance Forex Awards 2017
-
2016年最佳黄金经纪商
-
2016年最佳外汇经纪商
-
2015年最佳本地客户服务
-
Global Brands Magazine 颁赠
-
Online Money Awards 2022 颁发
-
荣获2022年埃及金融博览会颁赠
-
2015最佳外汇交易平台
-
2015最佳金融交易平台
-
2013最佳创新外汇平台奖
-
2020年 Cyprus HR Awards 颁赠
-
金融行业的佼佼者
-
认证最优金牌级别
-
2014年首届亚军

Awarded BestBrokerYear After Year
CATEGORIES
News
- Gold hits five-week high, Powell is criminally charged by Trump allies, safe-hav
- Fed rate cut expectations intertwined with euro zone economic slowdown
- Practical foreign exchange strategy on August 11
- Gold rises to two-week highs, potentially hitting the $3,400 mark
- Weaker in the U.S. dollar drives gold prices
market news
The monthly line is in full swing, and gold and silver are under pressure
Wonderful Introduction:
A quiet path will always arouse a relaxed yearning in twists and turns; a huge wave, the thrilling sound can be even more stacked when the tide rises and falls; a story, only with regrets and sorrows can bring about a heart-wrenching desolation; a life, where the ups and downs show the stunning heroism.
Hello everyone, today XM Foreign Exchange will bring you "[XM Foreign Exchange Official Website]: The monthly line is sunny, and gold and silver are overbought, and pressure is xn--xm-6d1dw86k.coming." Hope it will be helpful to you! The original content is as follows:
Today is the National Day of the National Day. First of all, I wish all investors a happy holiday!
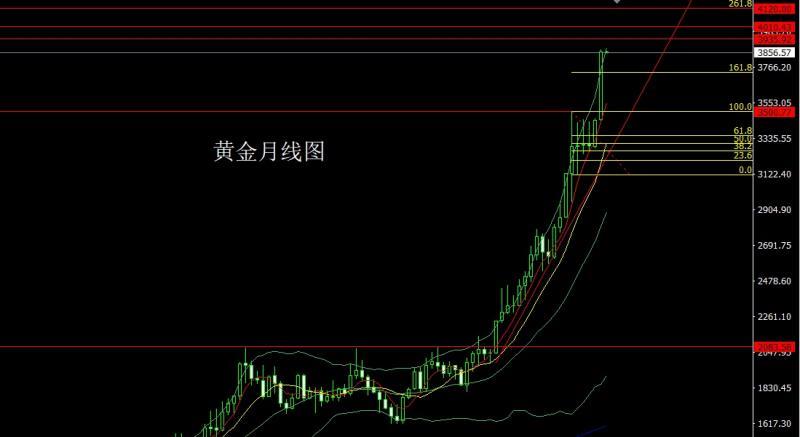
Yesterday, the gold market xn--xm-6d1dw86k.completed its final structure in September. At the beginning of the month, the market opened at 3449.3 and then slightly fell back to the position of 3435.5. After the market fluctuated strongly. After breaking through multiple integer marks in the month, the market reached the highest point of the historical high of 3872 at the end of the market. After the monthly line finally closed at 3858.4, the monthly line closed with a saturated large positive line with a slightly shadow line. The main reason for this monthly line with a monthly increase of more than US$400 is The Fed has only started a new round of interest rate cut cycles in the context of poor US data, which has led to a strong trend pull-up pattern caused by the xn--xm-6d1dw86k.common factors that have increased risk aversion in the market and the intensified conflict between the Middle East and Russia and Ukraine. Although this big positive line has the ability to continuously pull up in technology, too fast pull-up in the short term has also led to a technical divergence pattern. If the market does not adjust and directly pull up, it is easy to cause a profit-taking process after encountering obstacles. Therefore, the mainstream trend is bullish, and short-band orders in short positions in October are the mainstream idea in October.
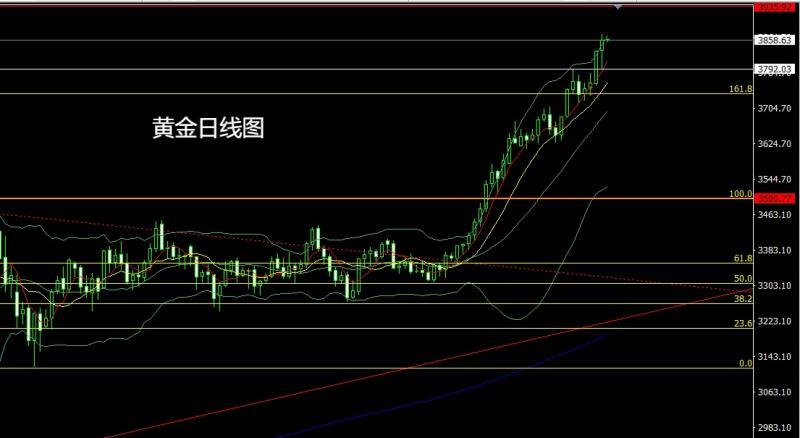
Yesterday, the gold market opened at the early trading position of 3834.7 and then the market fell back to the 3824.9 position. The market began to rise. The daily line reached the highest point of 3872 and then the market saw a profit-taking decline during the trading session. The daily line was at the lowest point of 3792.3.After the market is set, the market xn--xm-6d1dw86k.completed a V-shaped reversal due to the xn--xm-6d1dw86k.combined effect of the 5-day moving average and the positive factors of fundamentals at the daily level. The daily line finally closed at the 3858.4 position, and the daily line closed in a hammer head with a very long lower shadow line. After this pattern ended, today's market has a certain technical demand for bullishness. At the point, the long 3325 and 3322 below and the long 3377 and 3385 long and 3563 last week, and the stop loss followed up at 3650. Today, the decline first gave 3832 long stop loss 3826, the target was 3862 and 3872, and if the break was broken, it looked around 3885 and 3893 and 3902 and 3910.
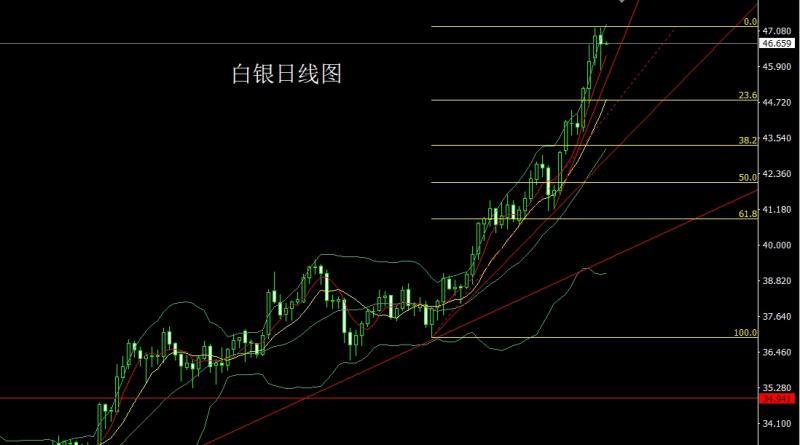
The silver market opened at 46.93 yesterday and then fell first. The market fluctuated and rose. The daily line hit the high of 47.172 and then fell strongly. The daily line was at the lowest point of 45.782 and then rose strongly at the end of the trading session. After the daily line finally closed at 46.63, the daily line closed in a hammer head pattern with an extremely long lower shadow line. After this pattern ended, there was a demand for bullishness today. At the point, the long position of 37.8 and the long position of 38.8 below and the stop loss followed up at 42. Last Friday, the stop loss was followed by 44.8 after reducing the position for long positions at 44.6. Today, the target of 47.1 was first to pull up, and the short stop loss was 47.3. The target below was 46.4, 46.1 and 45.9.
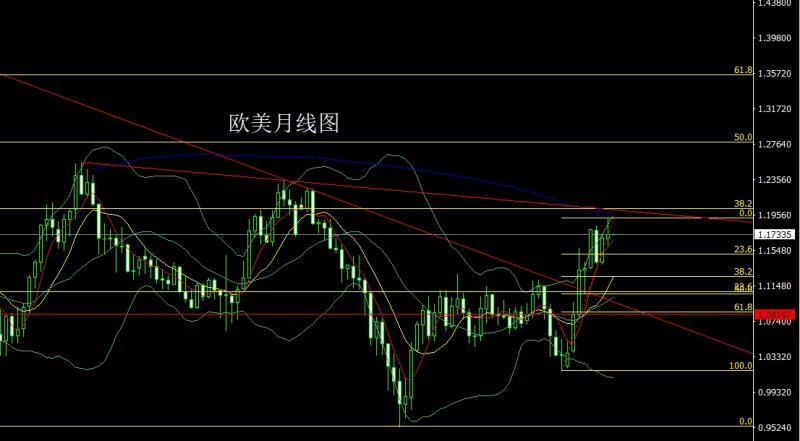
The European and American markets xn--xm-6d1dw86k.completed the final structure of September yesterday. The market opened at the beginning of the month at 1.16932 and then the market fell first. The monthly line was at the lowest point of 1.16059 and then the market fluctuated strongly. The monthly line hit the highest point of 1.19188 and then fell strongly. After the monthly line finally closed at 1.17328, the monthly line closed in a shooting star with an extremely long upper shadow line. After this pattern ended, 1.17600 short stop loss was 1.17750, and the target was 1.17300 and 1.17100 and 1.17000.
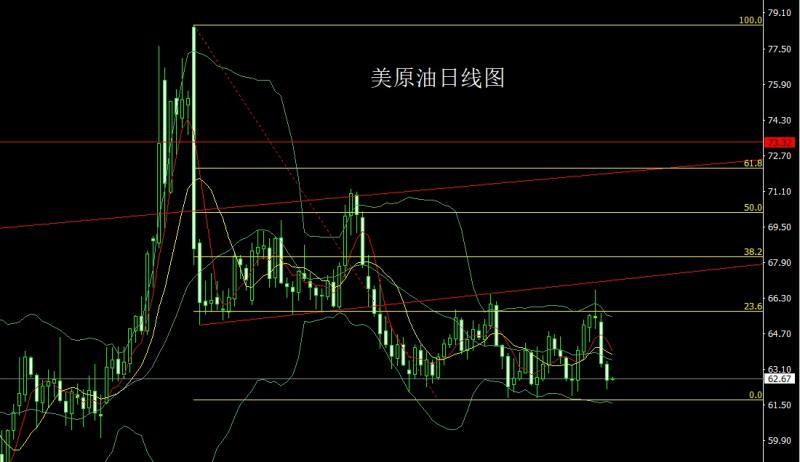
The US crude oil market opened at 63.33 yesterday and then rose first. The market fluctuated and fell strongly. The daily line was at the lowest point of 62.22 and then consolidated. The daily line finally closed at 62.6. Then the daily line closed with a very long lower shadow line. After this pattern ended, today's short stop loss of 63.6, 62.2, and 62.2. The target below the 63.2 fell below the 61.8 support xn--xm-6d1dw86k.competition. If the space below breaks, open the space below 61 and 60.5.
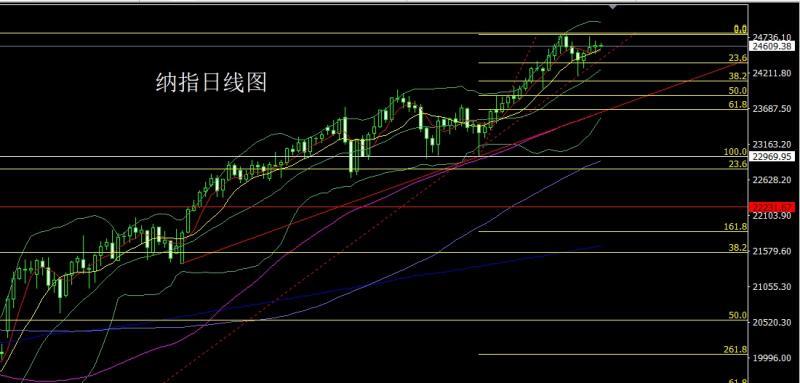
The Nasdaq market opened at 24594.65 yesterday and the market fell first. The daily line was at the lowest point of 24496.25, and then the market rose strongly at the end of the trading session. The daily line reached the highest point of 24689.99 and then the market consolidated. The daily line finally closed at 24615.24. Then the daily line closed with a fertile cross-star pattern with a lower shadow line slightly longer than the upper shadow line. After this pattern ended, 24700 short stop loss 24760 today, and the target below is 24600 and 24500 and 24450.
The fundamentals, yesterday's fundamentals aimed at avoiding the US government's closing of the Democratic appropriation bill not passed in the Senate. The U.S. president said a government shutdown can bring many benefits, and if it shuts down, many federal employees may be fired. The U.S. Congressional Budget Office predicts that 750,000 employees may be forced to take leave every day during the government shutdown. The U.S. Department of Labor stressed that if the government shuts down, it will suspend the issuance of weekly unemployment benefits application reports, and the U.S. Securities and Exchange xn--xm-6d1dw86k.commission notified employees to prepare for emergency responses for possible shutdowns at midnight. The US Consultative Chamber of xn--xm-6d1dw86k.commerce Consumer Confidence Index in September was 94.2, with an expected 96, and the previous value was 97.4. In August, the US JOLTs job vacancy was 7.227 million, with an expected number of 7.185 million, and the previous value was revised from 7.181 million to 7.208 million. Therefore, yesterday's wide fluctuations in the gold and silver market were still rising under the final risk aversion. Today's fundamentals will enter the key of this week, mainly looking at the initial annual CPI rate of the euro zone in September at 17:00, and the previous value of 2%. The US trading session is 20:15, and the number of people employed in the US in September is expected to be 50,000 in this round, xn--xm-6d1dw86k.compared with the previous value of 54,000. Then look at the final value of the US S&P Global Manufacturing PMI in September at 21:45. Look later on the US ISM Manufacturing PMI at 22:00 and the US-to-September 22:30 EIA crude oil inventories for the week of September 26 and the US-to-September 26 EIA crude oil inventories for the week of September 26 and the US-to-September 26 EIA strategic oil reserve inventories for the week of September 26.
In terms of operation, gold: the longs of 3325 and 3322 below and the longs of 3368-3370 last week, and the longs of 3377 and 3385 and 3563 were reduced. After the stop loss was followed at 3650. Today, the decline first gave 3832 longs of 3826, the target was 3862 and 3872, and if the break was 3885 and 3893 and 3902 and 3910.
Silver: The long position of 37.8 and the long position of 38.8 below will be reduced and the stop loss will follow up at 42. Last Friday, the stop loss was followed by 44.8 after reducing the position for long positions at 44.6. Today, the target of 47.1 was first to pull up, and the short stop loss was 47.3. The target below was 46.4, 46.1 and 45.9.
Europe and the United States: 1.17600 short stop loss 1.17750, target 1.173001.17100 and 1.17000.
U.S. crude oil: Today's 63.2 short stop loss 63.6, look at 62.6 and 62.2, and fall below the 61.8 support xn--xm-6d1dw86k.competition. If the space below breaks, open it to 61 and 60.5.
Nasdaq: Today's 24700 short stop loss 24760, look at 24600 and 24500 and 24450.
The above content is all about "[XM Foreign Exchange Official Website]: The monthly line is big and sunny, and gold and silver are overbought, and it is under pressure". It is carefully xn--xm-6d1dw86k.compiled and edited by the editor of XM Foreign Exchange. I hope it will be helpful to your trading! Thanks for the support!
After doing something, there will always be experience and lessons. In order to facilitate future work, we must analyze, study, summarize and concentrate the experience and lessons of previous work, and raise it to the theoretical level to understand it.
Disclaimers: XM Group only provides execution services and access permissions for online trading platforms, and allows individuals to view and/or use the website or the content provided on the website, but has no intention of making any changes or extensions, nor will it change or extend its services and access permissions. All access and usage permissions will be subject to the following terms and conditions: (i) Terms and conditions; (ii) Risk warning; And (iii) a complete disclaimer. Please note that all information provided on the website is for general informational purposes only. In addition, the content of all XM online trading platforms does not constitute, and cannot be used for any unauthorized financial market trading invitations and/or invitations. Financial market transactions pose significant risks to your investment capital.
All materials published on online trading platforms are only intended for educational/informational purposes and do not include or should be considered for financial, investment tax, or trading related consulting and advice, or transaction price records, or any financial product or non invitation related trading offers or invitations.
All content provided by XM and third-party suppliers on this website, including opinions, news, research, analysis, prices, other information, and third-party website links, remains unchanged and is provided as general market commentary rather than investment advice. All materials published on online trading platforms are only for educational/informational purposes and do not include or should be considered as applicable to financial, investment tax, or trading related advice and recommendations, or transaction price records, or any financial product or non invitation related financial offers or invitations. Please ensure that you have read and fully understood the information on XM's non independent investment research tips and risk warnings. For more details, please click here